Image Analysis
Here we explore first a web toy, and then some more complex approaches for identifying patterns in visual materials.
Introduction
In recent years, historians have started to deal with photographs or videos / video stills as historical documents. Arnold and Tilton call this ‘distant viewing’. There are a variety of ways this might pan out; one might identify and analyze colour and composition of key frames in a recording of a historical event. One might track objects or people. In a recent piece of my own, we asked the computer to identify objects and contexts to describe ‘scenes’ in images pulled from Instagram, in order to explore how people constructed their own ‘cabinets of curiosities’ (which you can read here, connected to the trade in human remains.) Lev Manovich has done a number of pieces looking at amongst other things, selfies by city, or 4535 covers of Time magazine (more on his work here). Ian Milligan extracted art work from the first era of the web, the 1990s, and used ImageJ to study patterns in how people presented them on Geocities.
There’s a lot you can do, and there are many different approaches.
Gallery-DL
I assume you have a folder filled with images you want to explore. If not, there is a python based tool called Gallery-DL that you can install at the command prompt with:
$ python -m pip install -U gallery-dl
then, you point gallery-dl at the URL for a gallery on a website like flickr,
$ gallery-dl "https://full-path-to-the-gallery-of-images"
and if all goes according to plan, you’ll have a lot of images to work with in short order. There’s more information about gallery-dl here. This tool doesn’t work with every site; sometimes, wget or an API is a more appropriate way to go. (And sometimes, you have to build your own damned scraper; here’s one that works with the Canadian Museum of History; here’s one for Hathi and here’s one for The Internet Archive. There’s an excellent Programming Historian tutorial you should check out too.)
Right. Assuming you’ve got some images handy that you want to explore…
Imj
Here, we’ll use a web toy by Zach Whalen called ‘Imj’. Whalen writes,
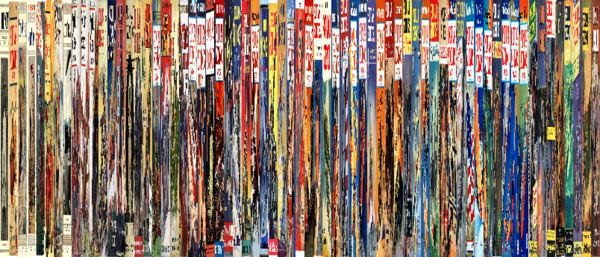
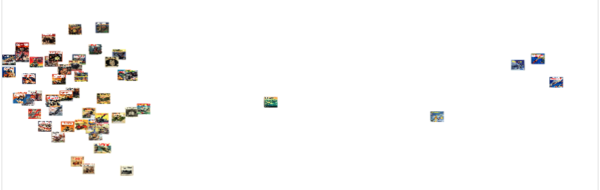
So-called “movie barcodes” are both elegant to look at and useful ways to explore how color schemes and designs shift throughout a film. Image montages can also demonstrate how a visual corpus changes over time, and plotting an image set into a graph based on values like hue and saturation could provide a stylistic fingerprint for particular set.
Visual culture analytics or macroanalytics is a methodology for drawing interpretations of large sets of data with the aid of computers. Just like scholars may use computational tools to analyze n-gram frequencies in literary corpora, for example, others also like Lev Manovich use software to create similarly condensed or arrayed views that reveal patterns and trends within visual corpora.
Imj is a tool for creating a rapid visualization of a corpus of images, so that you can determine whether or not you might like to look into more complex tools for deeper analysis. You can read Whalen’s description of what the tool does here.
- Download this corpus of materials: https://archive.org/details/0011919FebruaryPopularScience. These are covers from ‘Popular Science Monthly’ held at the Internet Archive. Hit the down button beside where it says ‘72 original’ to download it all as a zip file.
- Unzip it, have a look around inside; finder and explorer can show you thumbnails as you browse. Do you spot anything interesting?
- Look at the metadata. The metadata is actually there in the file name. If you sort the files alphabetically in your file explorer or finder you’ll see that you have covers from 1912 to 1946, and thus perhaps some insight into the popular consumption of science over thirty years. There are some files with
.torrentor.xmlor.sqlite; you can delete these. Then there are two files with typos in the years which you can rename easily. Delete the file for the thumbnail image too (which has ‘thumb’ in its filename.) - Upload to Imj here: http://www.zachwhalen.net/pg/imj/
- Try the different visualization tools. There is no ‘right’ answer to the question of visualization here. Instead, you are trying to ‘deform’ your perspective, you’re trying to get a large-scale overview, of interesting patterns that might be present. Some tools might give you more intuitively sensical results; but remember Matthew Lincoln’s warnings against ‘confabulation’… You might find, when you plot hue against brightness, that some interesting clustering seems to happen. Having spotted a pattern, jump back into the corpus to see why that might be the case…
- Go back to the Internet Archive, see if you can find other interesting image corpora to explore. How ambitious are you? Here are one million album covers!. Here are more magazines! With a bit of creativity, you could also grab all of Maclean’s Magazine for some CanCon.
- Download your results, add them to your notes and your current repo.
ImagePlot

ImagePlot is a macro (series of subcommands) for the image analysis program ImageJ. You can download a zip file containing both ImageJ and the ImagePlot macro from here
Download, unzip, and install ImagePlot 1.1 for your machine.
Fire it up.
Once it’s running, you go to plugins -> macros -> run.
Select the file ‘ImagePlot.txt’ in the ‘imageplot-master’ folder.
The ImagePlot macro window opens:
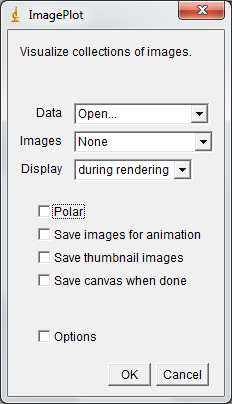
There is a comprehensive tutorial here on visualizing an image set with the imageplot macro explaining all of the various permutations that can come next. One obvious way to plot imagery, if we are historians, is to use the date the image was taken as a value on the x axis…


(and, just to blow your mind, check out ‘Lee and Jackson’, by Brian Foo.)
PixPlot
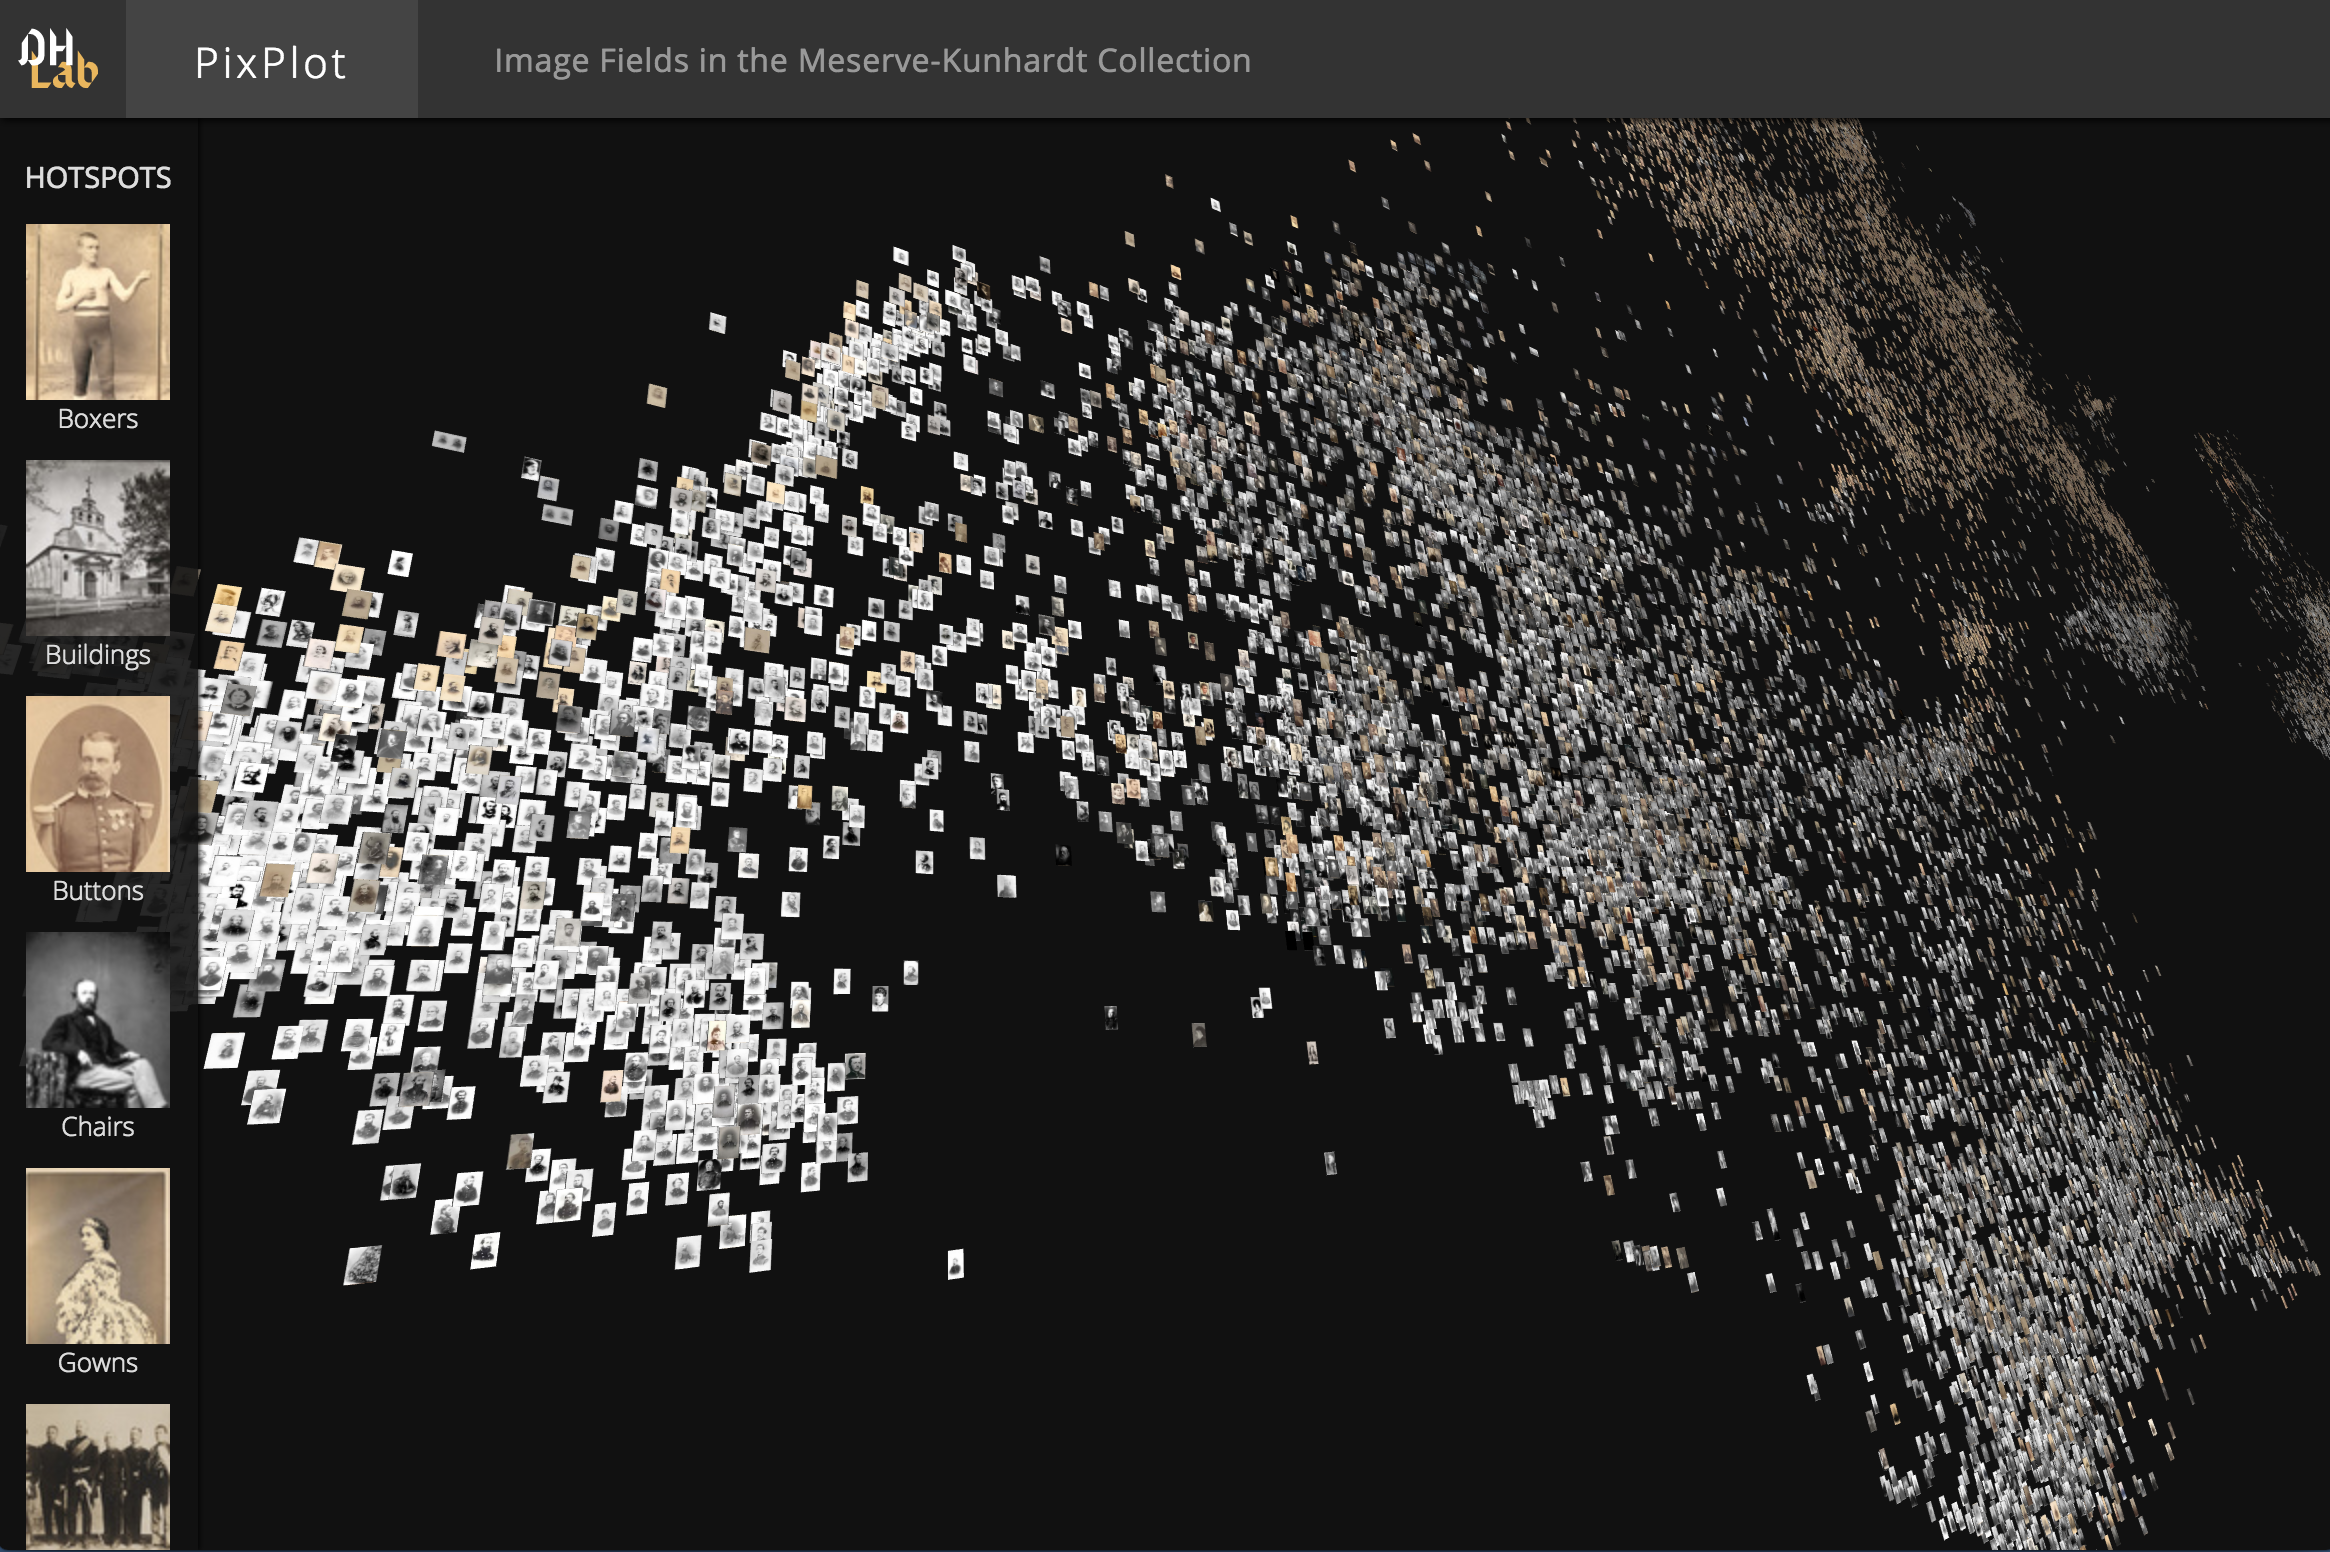
PixPlot is a more complex piece of code that uses neural networks to find visually similar images in terms of how the images are actually composed.
The algorithm converts the information in the image, the colour values of the pixels, into a series of present/absent evaluations. It pans across the image performing a series of these evaluations (convolution) where each calculation is sensitive to a different kind of arrangement of pixels. These values are passed up (or not) to another layer such that each successive layer responds to more complicated patterns or shapes. By analogy with the brain, each layer is imagined as a series of connected neurons. Each neuron responds to a different aspect of an image and all of these layers activate in different weightings of connections. The combination of those weightings allows for the identification of what’s going on in the image. The result is a mathematical representation (a 2048 dimensional vector) for every single image. In automatic image captioning, the final layer of neurons is used to assign the labels. Here, we look at the second to last layer, which is the vector representation of the image, and use t-SNE (t-Distributed Stochastic Neighbor Embedding) or other kinds of clustering algorithms to achieve ‘dimensionality reduction’ and find patterns of similarity within the images (van der Maaten 2014; van der Maaten and Hinton 2008). This gives us a macroscopic view of all of the (machine-visible) patterns inherent in the tens of thousands of images collected Huffer, Wood, and Graham 2019
Created by the Yale DH Lab, the code for PixPlot is at https://github.com/YaleDHLab/pix-plot. Here’s a demo of its results in action.
Create a new folder ‘image-work’. Open a command prompt / terminal in that folder. Then, we’ll create a new python environment just to work with pixplot:
$ conda create --name=pixplotwork python=3.7
$ source activate pixplotwork
We can install Pixplot from the command line with the pip command:
$ pip uninstall pixplot
$ pip install https://github.com/yaledhlab/pix-plot/archive/master.zip
Once the dust settles, place a folder with images you want to explore inside your image-work folder. Assuming your images are all jpgs, we now tell pixplot to do its thing on that folder:
$ pixplot --images "image-work/*.jpg"
When it finishes, you can use python’s built in webserver to explore your materials:
$ python -m http.server 5000
And go to http://localhost:5000/output to explore the results. Hit ctrl+c in the terminal to stop it.
If you want to make this visualization available on the web, create a new repo on github, enable github pages for the repo, and then drag and drop the contents of the /output/ folder into that repo.
###Image Glitching
…and maybe there is value in glitching images, breaking things; here’s a notebook to do that.