Sonification
When we write history, we appeal not just to the intellect, but also to emotional affect. Sonification might help us write better history.
Introduction
You’re familiar with graphs and charts. In a graph you take the values for one variable and mark them along the x axis. You take the values for a second variable and mark them along the y axis. Where those values intersect, you make a mark: and a simple xy plot is born. Sonification on the other hand maps those values to sonic tones, rather than visual markers. Thus there is also an implicit time variable as you listen; we understand the first tones as being temporally earlier than what we hear at the end. Sonification might be an appropriate technique for understanding historical data.
I have written a longer tutorial on Sonification at the Programming Historian that you might want to engage with more fully; I’ll just quote the opening two paragraphs here:
Sonification is the practice of mapping aspects of the data to produce sound signals. In general, a technique can be called ‘sonification’ if it meets certain conditions. These include reproducibility (the same data can be transformed the same ways by other researchers and produce the same results) and what might be called intelligibility - that the ‘objective’ elements of the original data are reflected systematically in the resulting sound (see Hermann 2008 for a taxonomy of sonification). Last and Usyskin (2015) designed a series of experiments to determine what kinds of data-analytic tasks could be performed when the data were sonified. Their experimental results (Last and Usyskin 2015) have shown that even untrained listeners (listeners with no formal training in music) can make useful distinctions in the data. They found listeners could discriminate in the sonified data common data exploration tasks such as classification and clustering. (Their sonified outputs mapped the underlying data to the Western musical scale.)
Last and Usyskin focused on time-series data. They argue that time-series data are particularly well suited to sonification because there are natural parallels with musical sound. Music is sequential, it has duration, and it evolves over time; so too with time-series data (Last and Usyskin 2015: 424). It becomes a problem of matching the data to the appropriate sonic outputs. In many applications of sonification, a technique called ‘parameter mapping’ is used to marry aspects of the data along various auditory dimensions such as pitch, variation, brilliance, and onset…
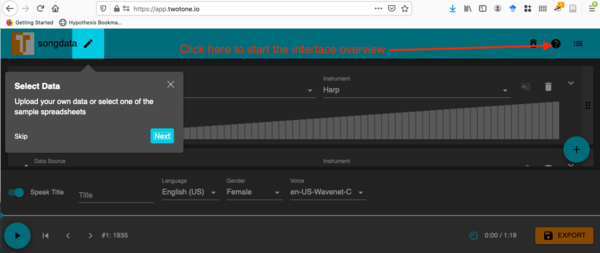
Two-Tone
For this exercise I want you to map the data from a historical source (your choice, but if you’re stuck, try some archaeological data) into the ‘Two Tone’ app; click the ? to see how to use its interface. You can explore some of the default data in that app, including ‘Prussian cavalry killed by horse kicks’ and ‘Honey Production in the USA (1998 - 2012)’. Use excel to prepare your data; have a column with some obvious time dimension, and then other columns for the different aspects of your data. Have a header row with the column names. Two tone will understand that each column should be mapped to a unique instrument (you can use the same columns for multiple instruments, too).
What tones, sounds, settings make sense given your data? How do different choices affect the meaning of what you’ve created? Is there anything meaningful? Save your music and your notes/thoughts on making it, to your repository. (You can also upload the song to something like soundcloud).
We remixed our archaeological sonification in Audacity, and added some beats; you can read about our experiment and what it might mean here.
Sonification via Python
This interactive online notebook walks you through the process of sonifying data using Python. It might take a while for the notebook to load up, if no one has invoked it lately.